OpenFGC
A fighting-game analytics product that unified fragmented Steam, Twitch, event, and player data into interfaces for event planning and sponsor conversations.
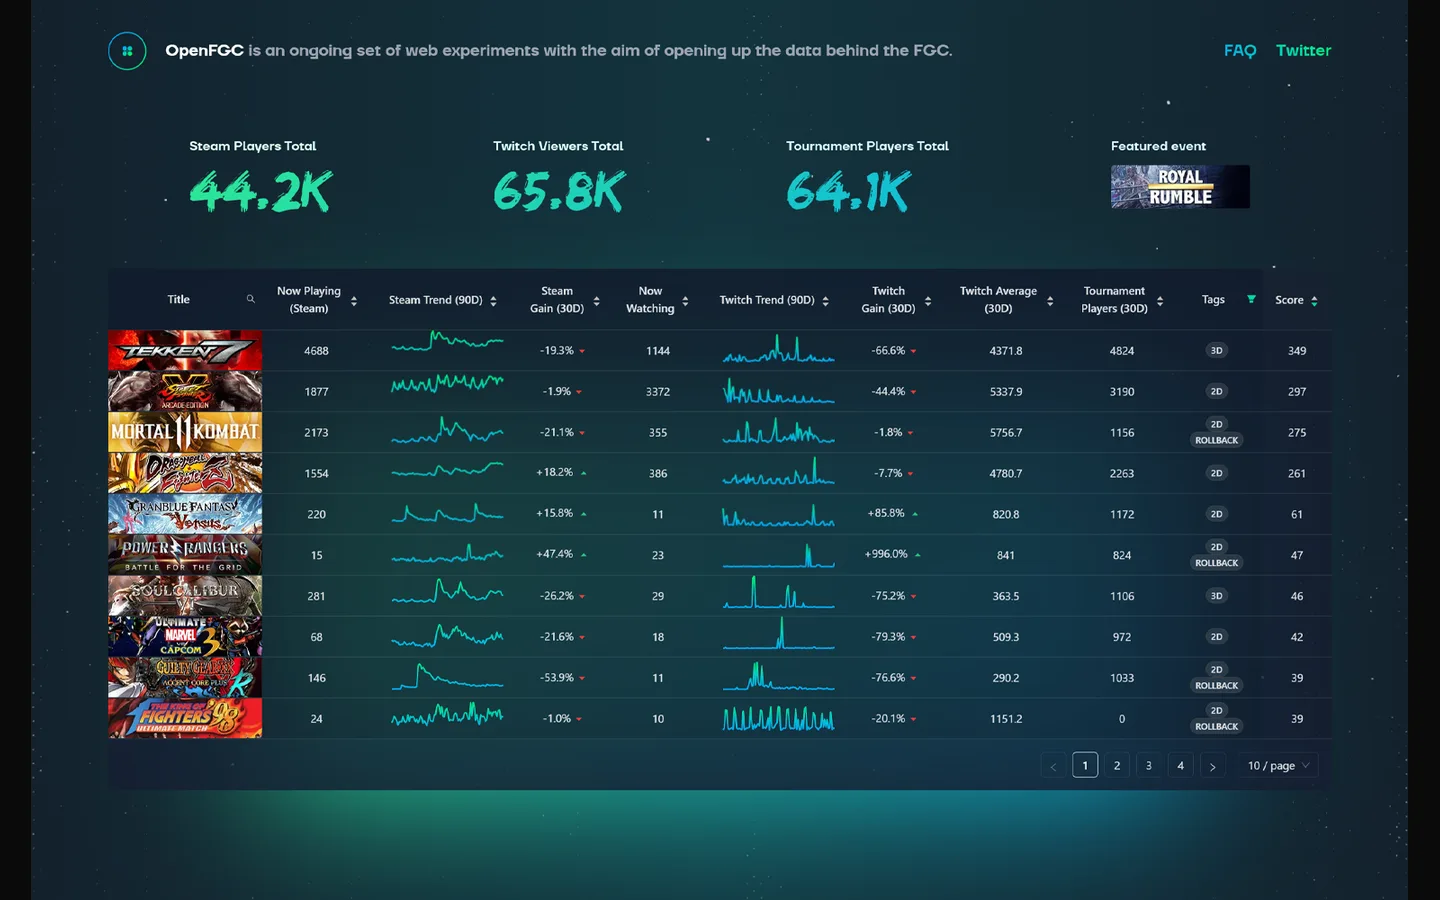
Smaller tournament organisers lacked the consolidated audience and player signals available to established esports organisations.
Separate fast, presentation-ready summaries from deeper player and event analysis so one dataset could support different decision speeds.
A restored working product, an end-to-end data pipeline, and interface artifacts covering summaries, profiles, breakdowns, and replay analysis.
One audience, fragmented signals
During the shift from offline to online events, smaller fighting-game tournament organisers had to explain audience value to sponsors using data spread across tournament, Steam, Twitch, and player sources. OpenFGC explored how those signals could become a coherent planning and presentation tool.
I owned the product framing, interface design, and MVP implementation. The work is retained as an earlier end-to-end product case study: it demonstrates the decisions and system that were built, without claiming adoption or business impact that was not measured.
Separate summary from investigation
The core information-architecture decision was a two-speed product. A compact overview exposed the figures an organiser might need in a sponsor conversation; player profiles and breakdown views supported deeper comparisons and event planning.
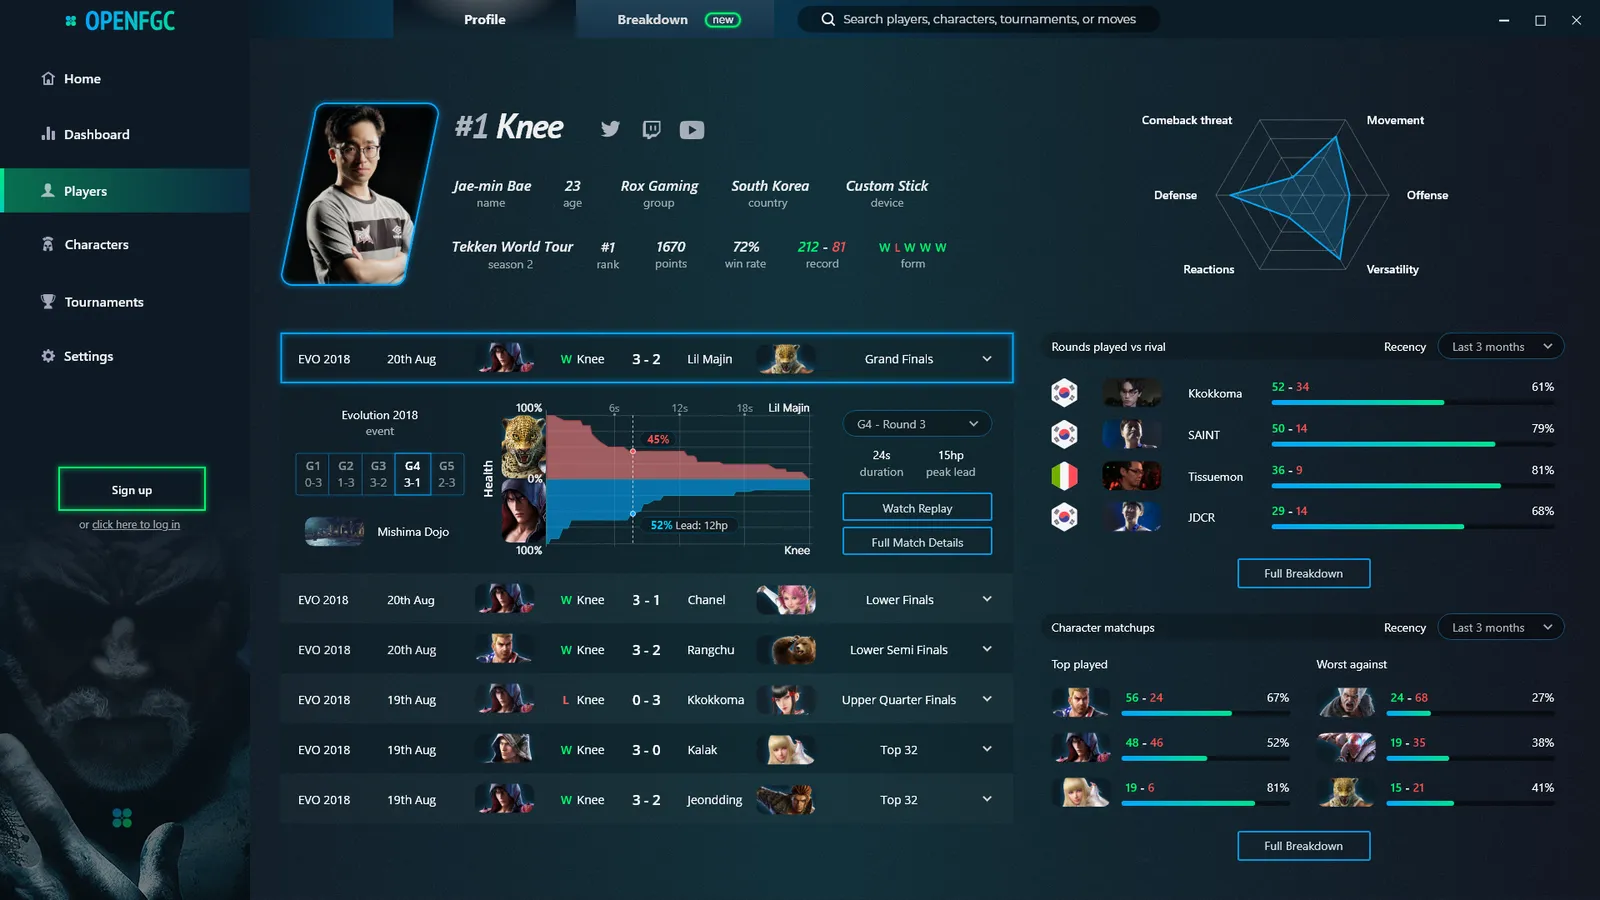
Design the question before the chart
The interface prioritised comparisons that could change a decision: player reach, game activity, event performance, and the relationship between participants and likely viewership. Decorative metrics were kept out of the summary layer and available only when a user moved into analysis.
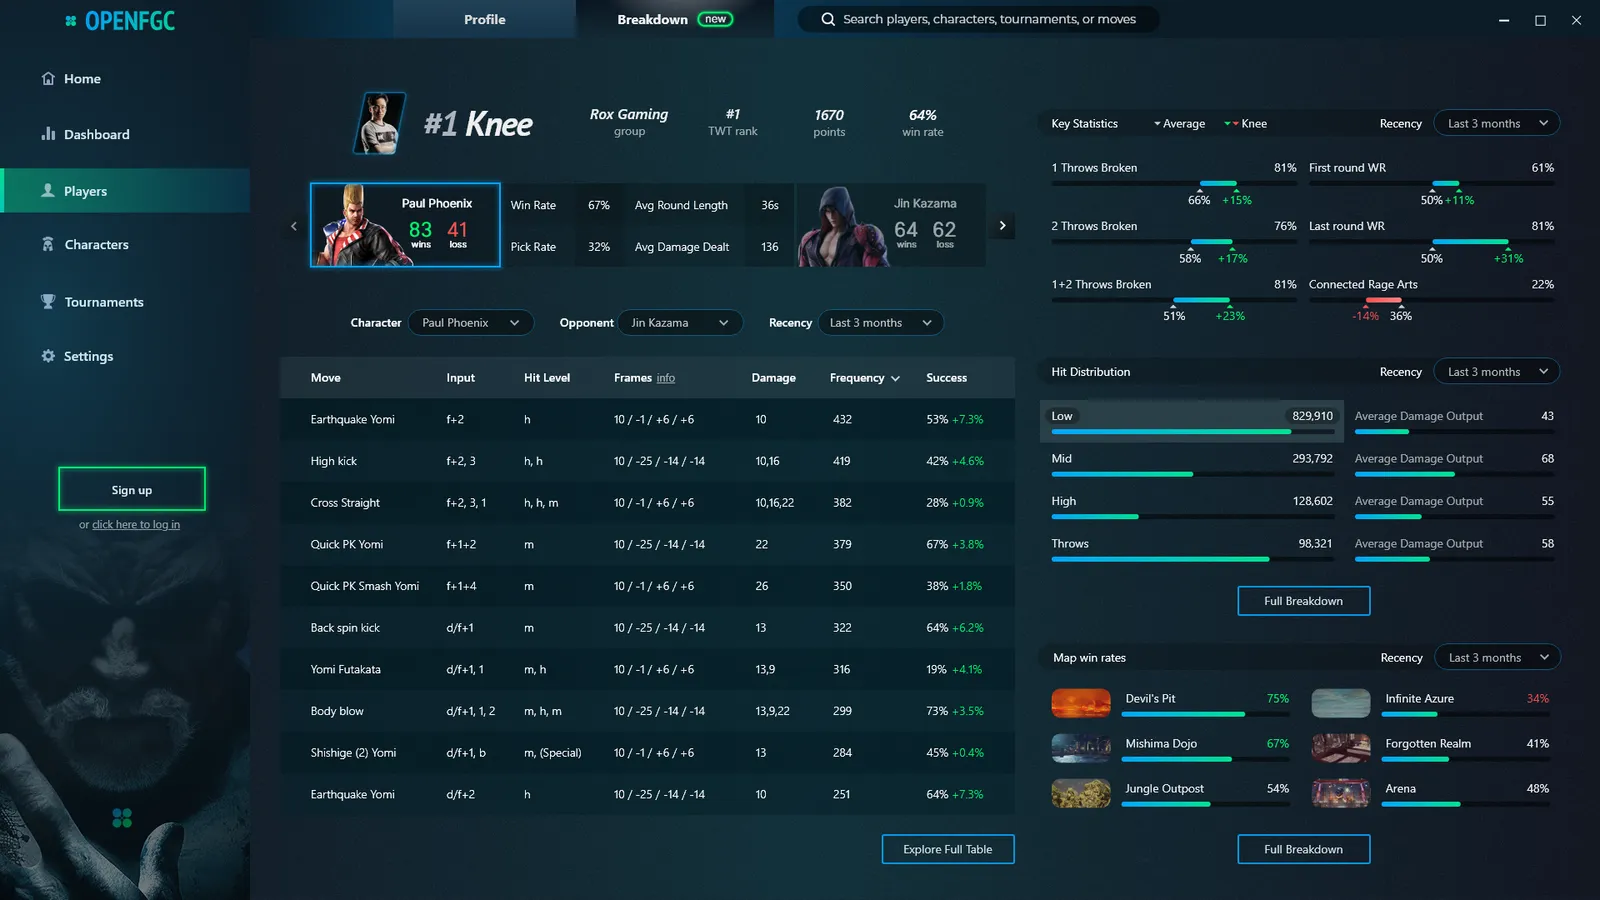
What the prototype proved—and did not prove
The build proved that the fragmented inputs could be normalised into a usable product model and that summary and analyst views could share that model. It did not establish a measured improvement in event outcomes, sponsor conversion, or organiser productivity.
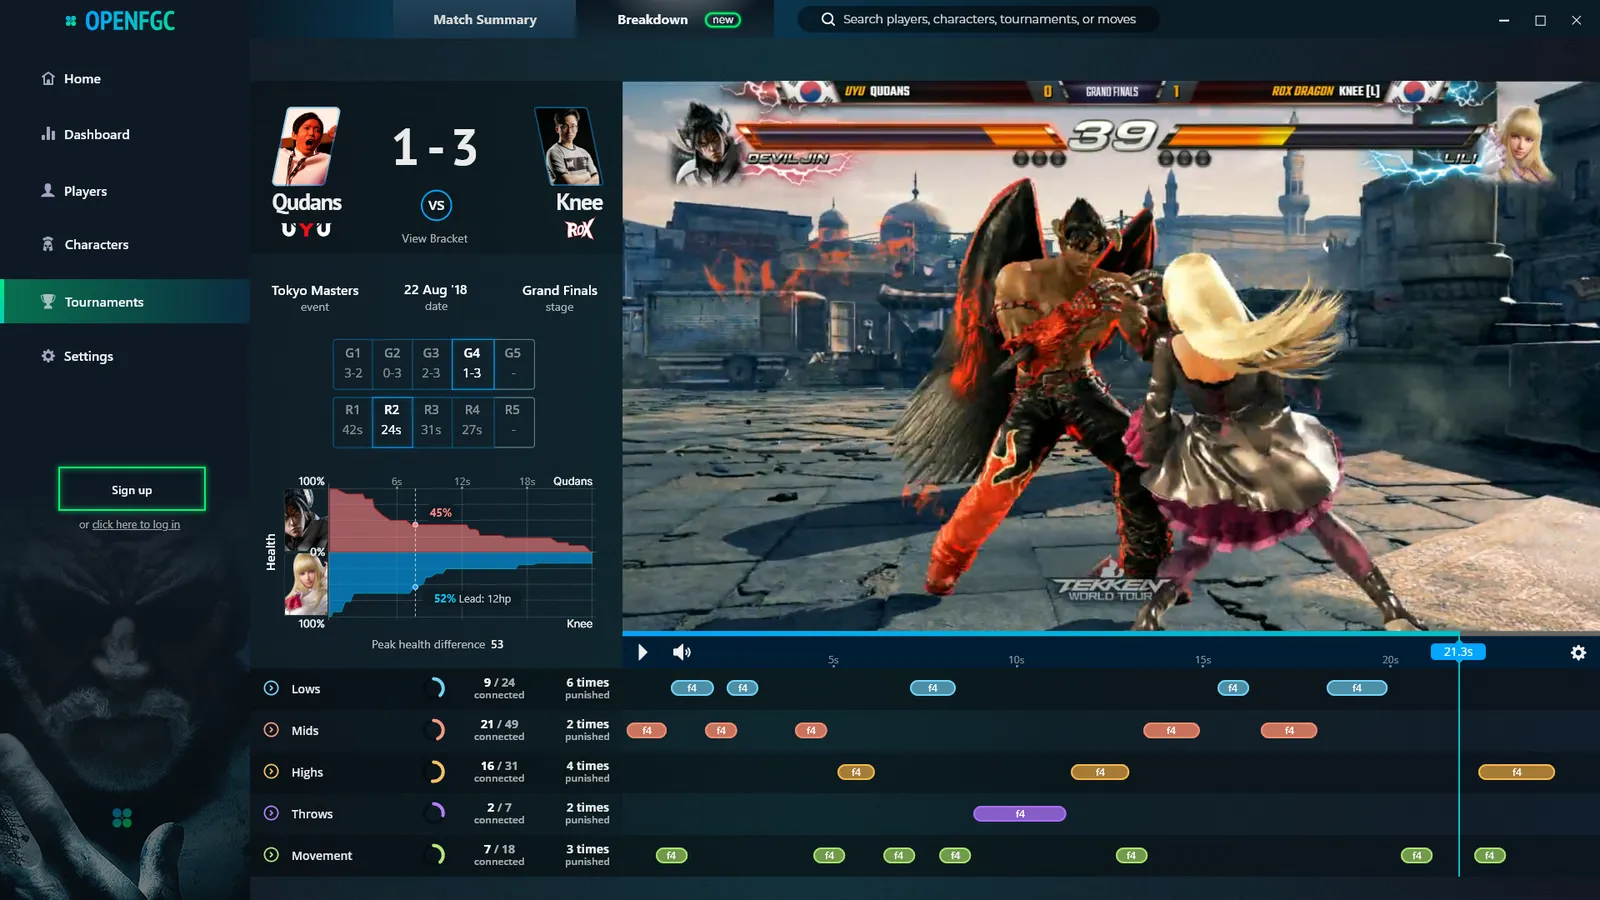
Restoring the original deployment at a maintained subdomain keeps the interaction inspectable. If I resumed product development, the next step would be organiser interviews and task-based validation before adding more metrics.